Padelscout Analytics

Market intelligence for padel in Germany and Austria.

Demand, utilization and pricing for the padel venues we track, plus market coverage by region, derived from continuously observed booking activity. For operators who want to know where their club stands, and for investors weighing up a location.

Padelscout Analytics launches soon.

From the whole market down to a single club.

Four ways into one dataset. Every figure shows what it is based on.

Market overview

How big is the market, and how busy?

Supply and market coverage per country, demand for the period you choose, plus the shape of the market: club sizes, booking channels and new openings.

  • Supply and demand for Germany and Austria
  • Market structure and new openings over time
  • Market coverage stated per region
About the market overview

Market report

As of today

Germany

Clubs

393

Courts

1,465

Locations

299

Avg. courts per club

3.7

Live from the tracked venues, as of today

Market map and regions

Where is demand high and supply short?

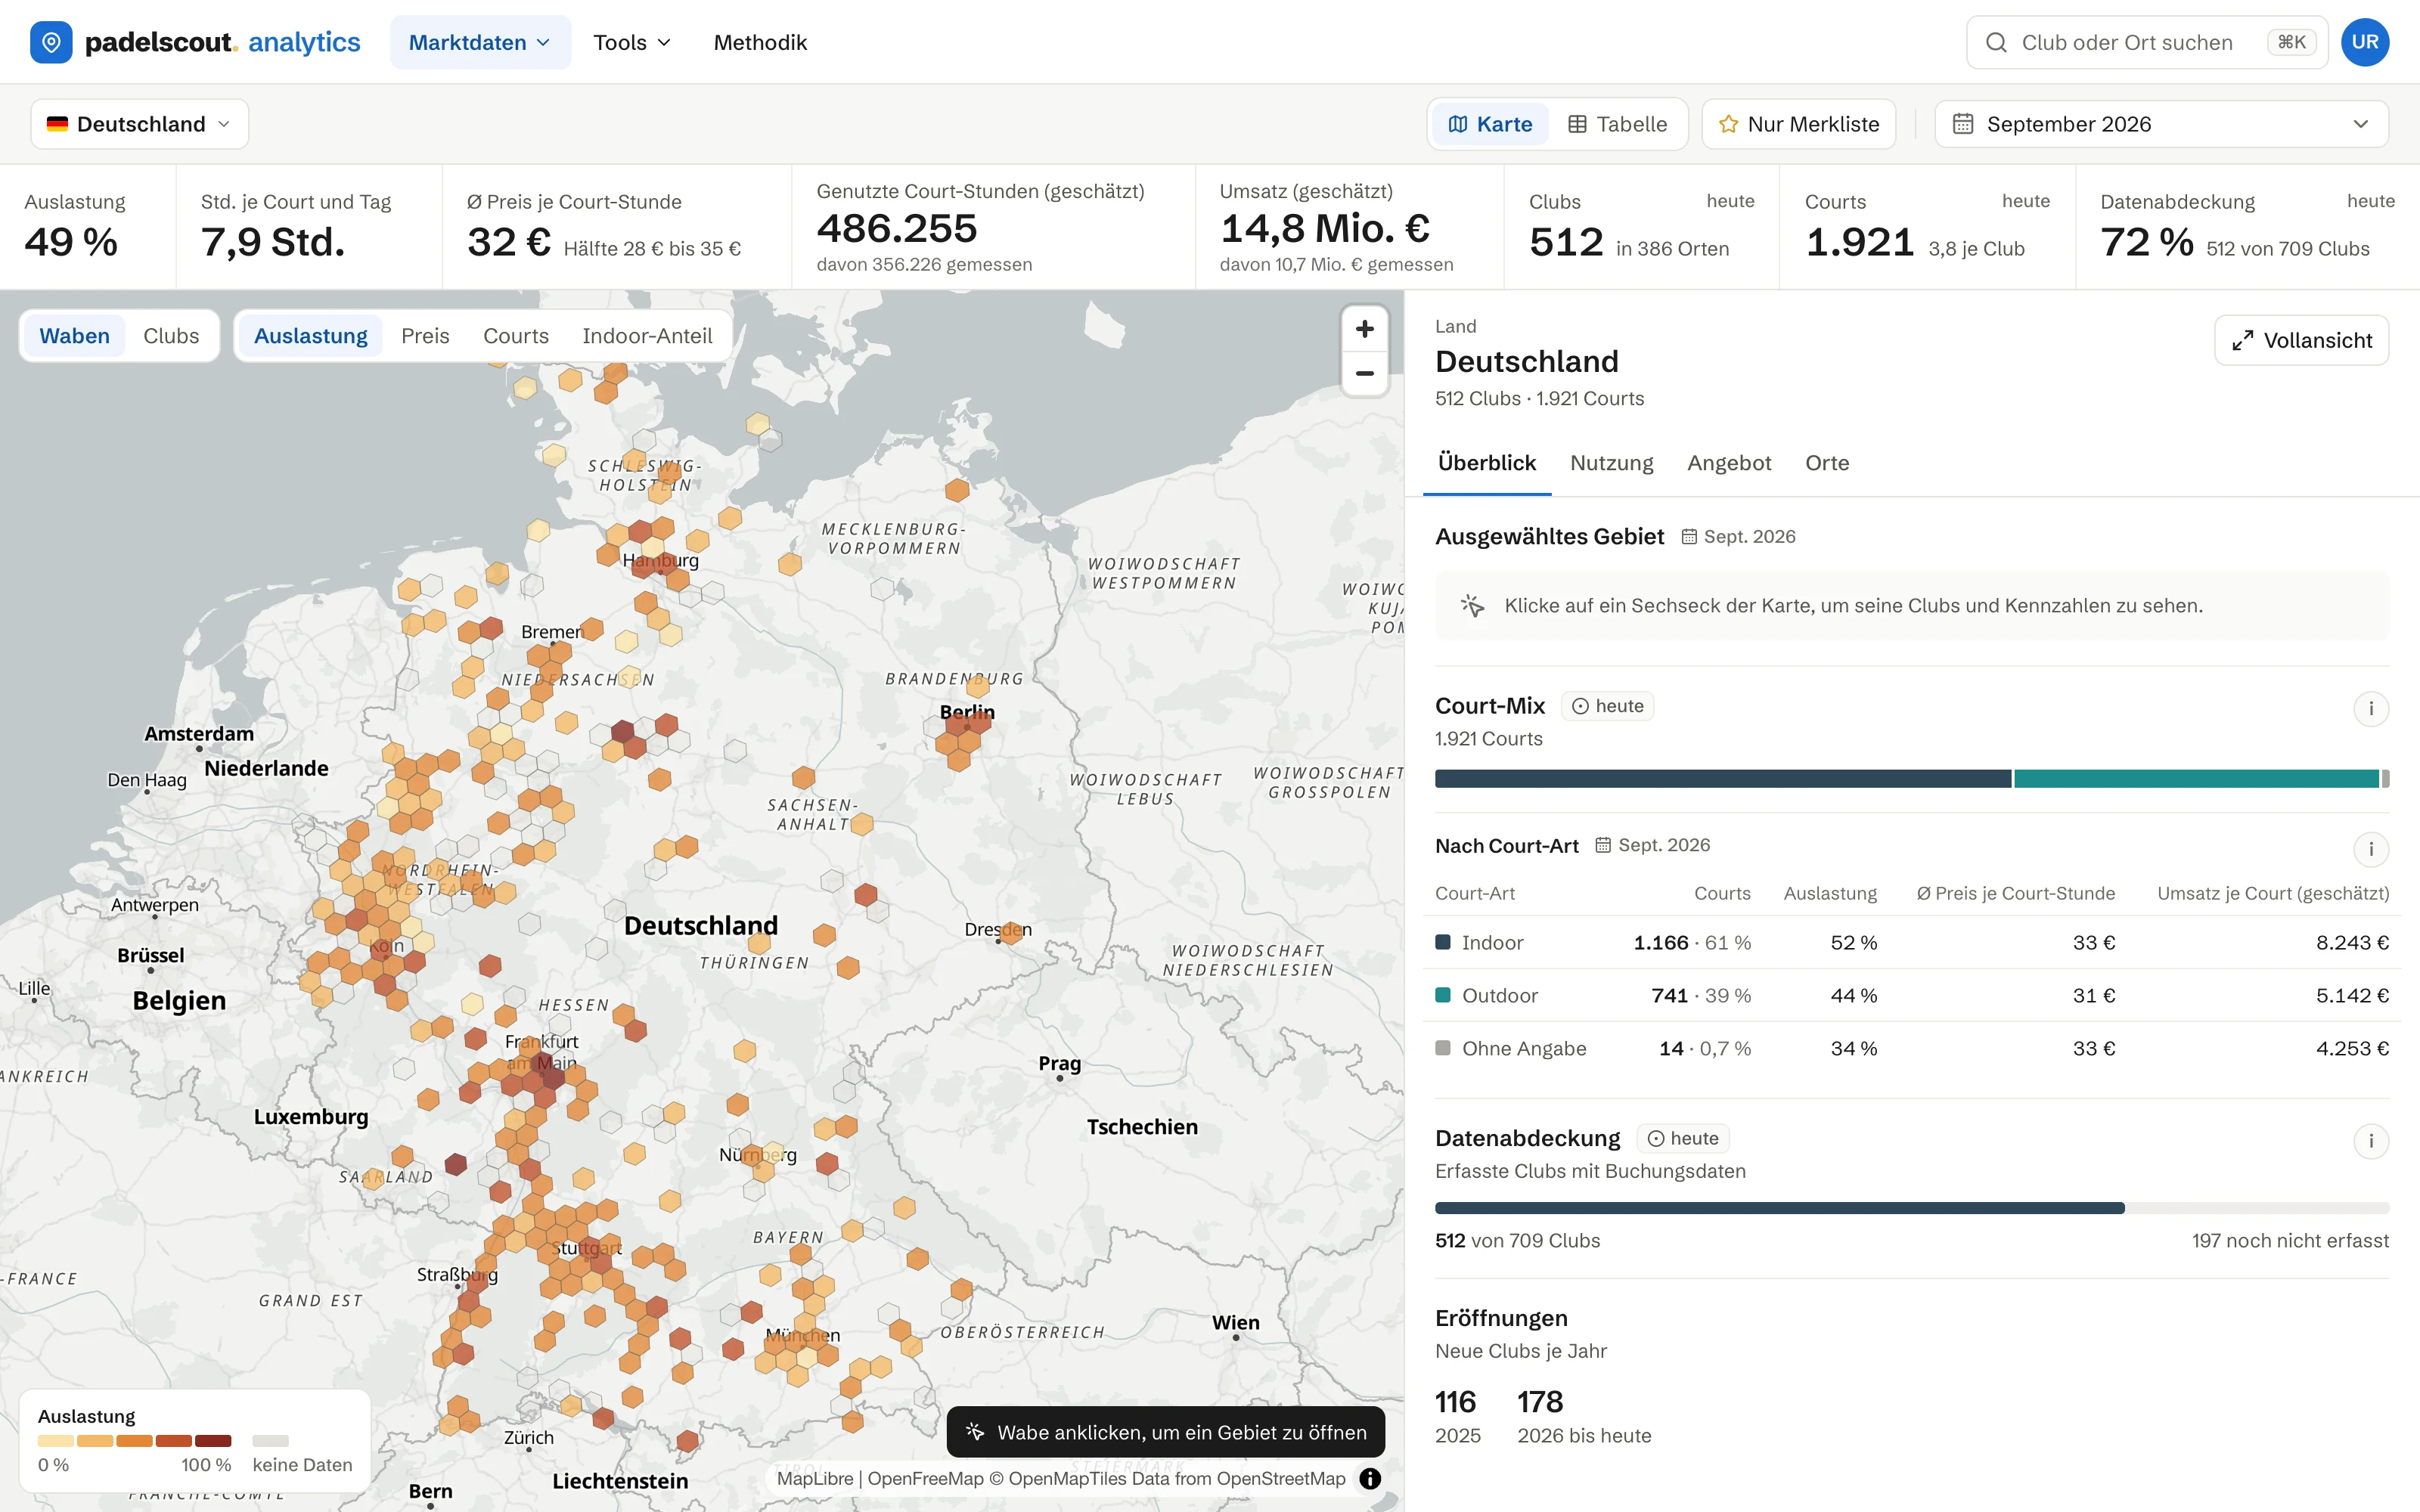
The market map lays demand and supply over both countries as a hex grid. Region reports go one level deeper: metro areas side by side, peak hours and the clubs in each area.

  • Demand and occupancy rate per area
  • Underserved and saturated regions at a glance
  • Peak hours per region
About the market map
Detail of the market map: demand hexes over Germany

Selected area

1 club · 3 courts

Demand rate38%

Sample view with demo data

Club reports and comparison

Where does a club stand against its peers?

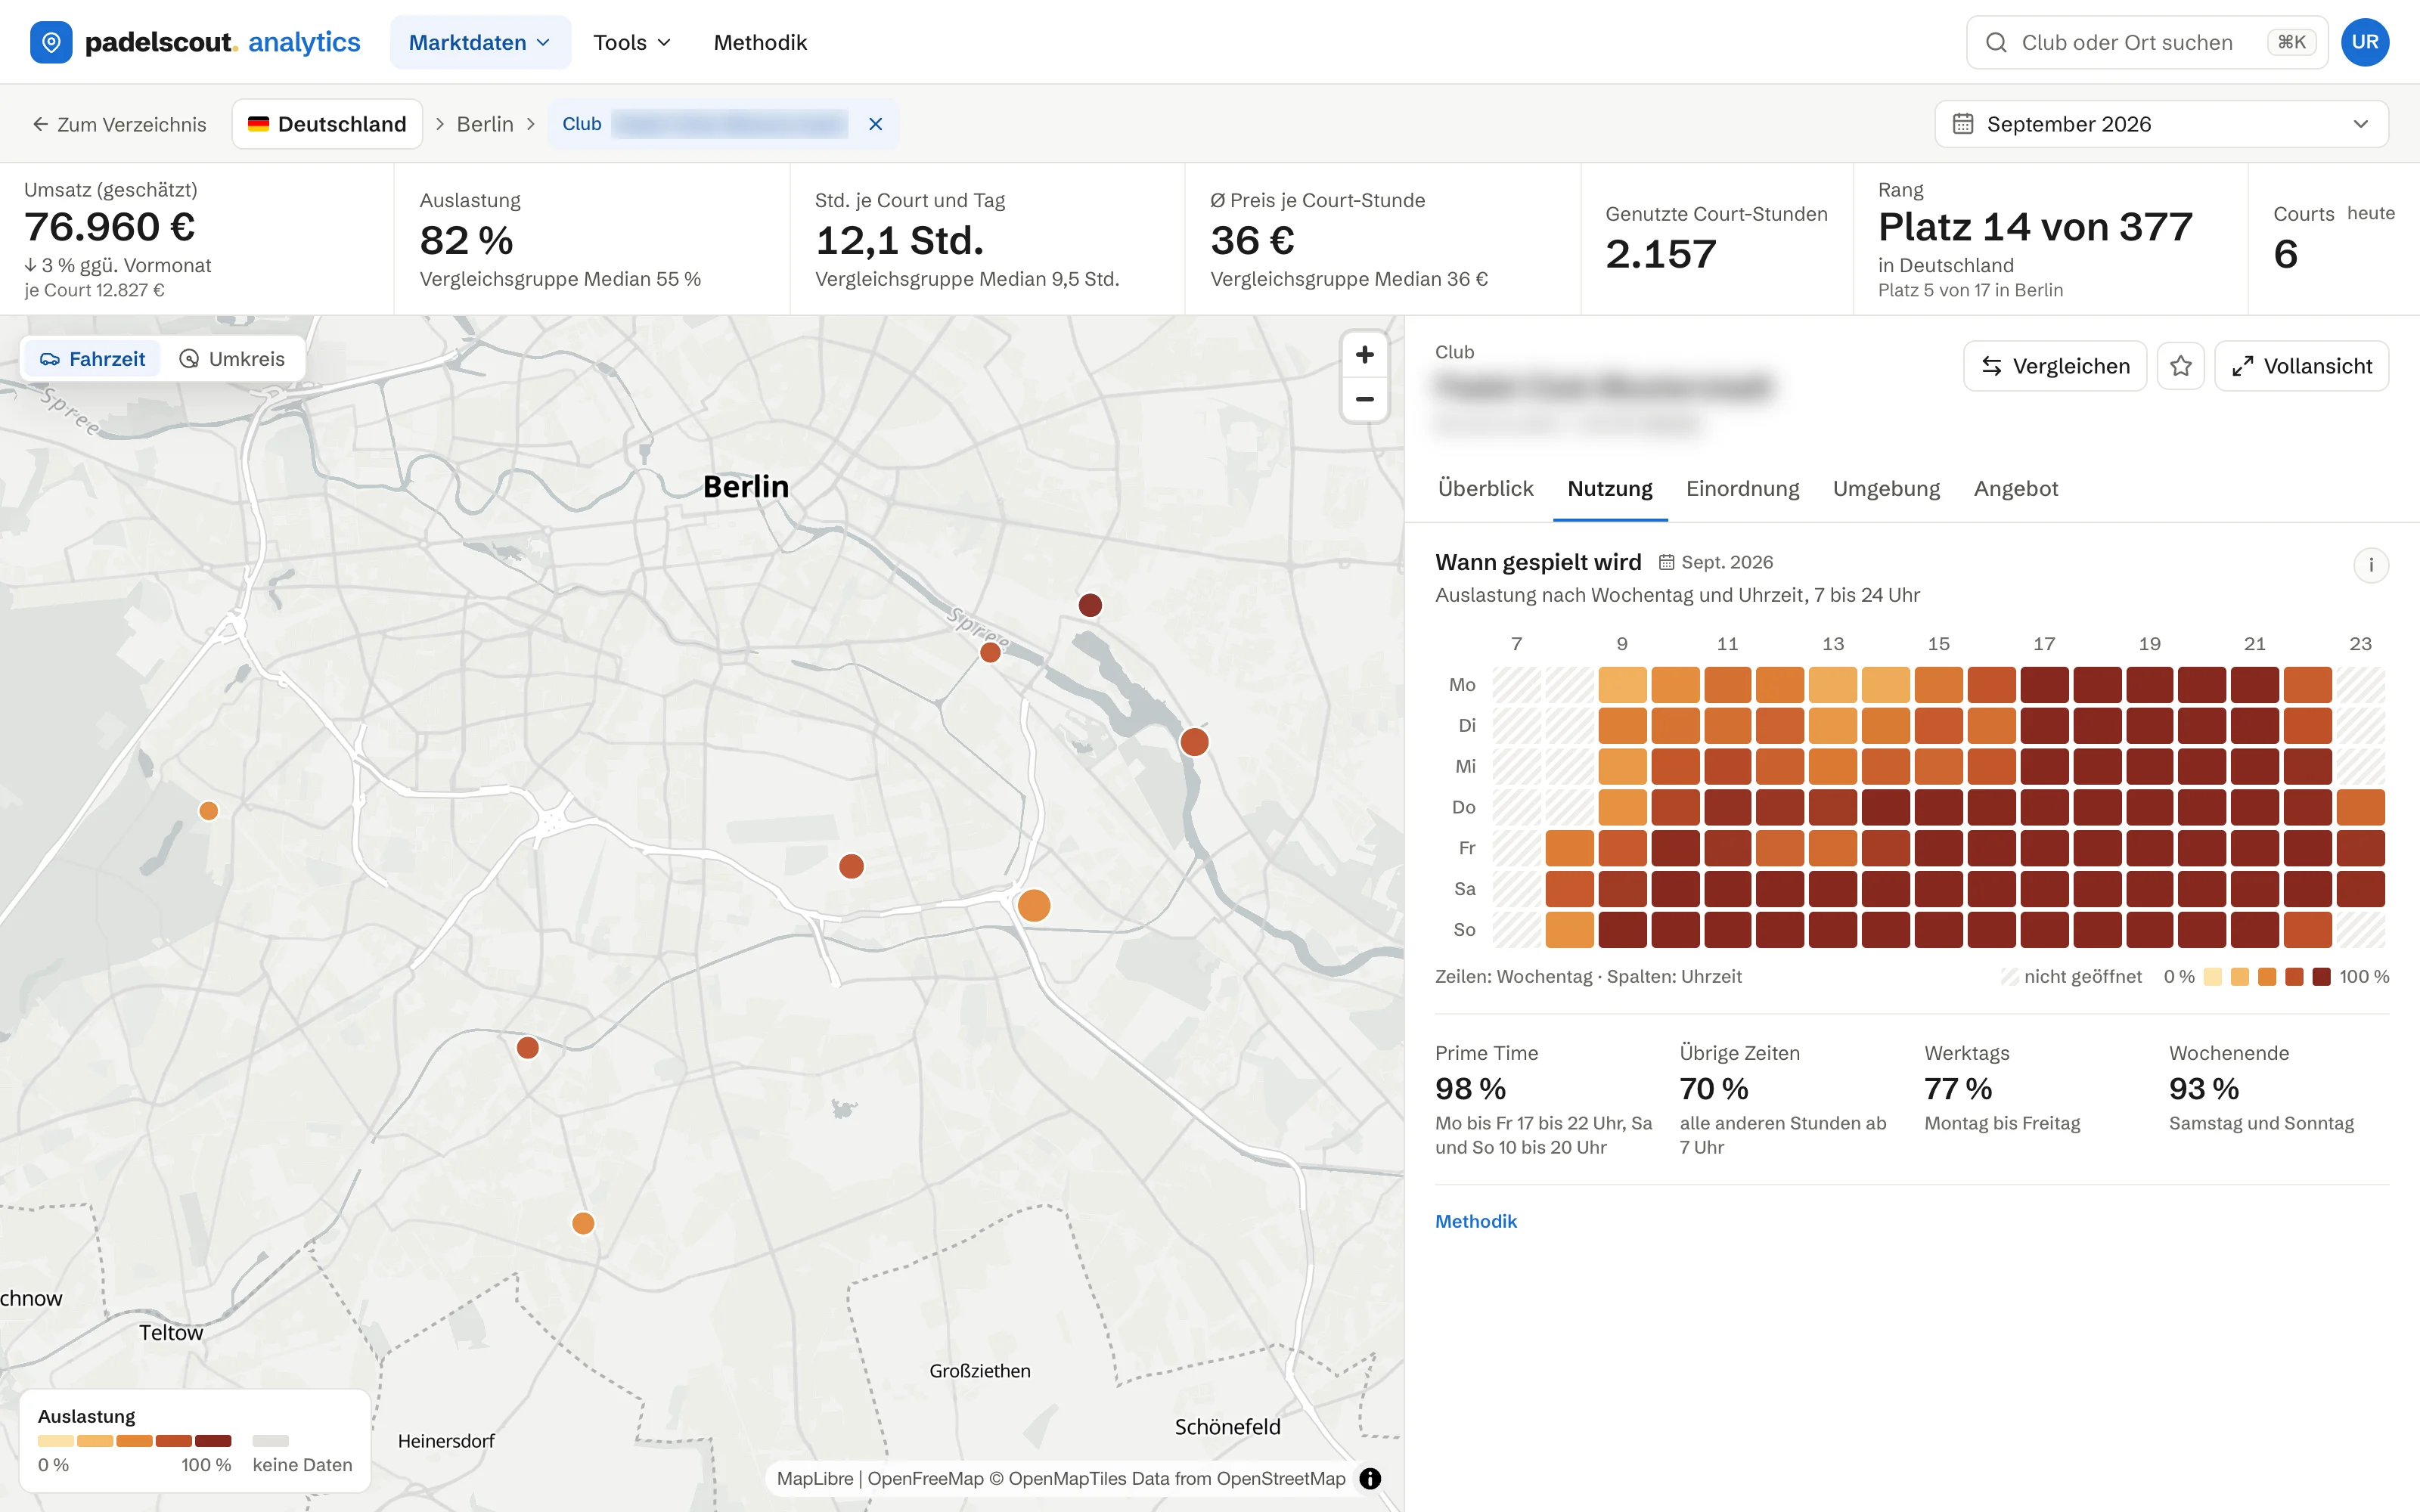
A club's utilization and realized prices, set against similar clubs nearby, plus its peak hours. The comparison view puts up to four clubs side by side.

  • Demand, occupancy and prices with a peer group
  • Rank in the country and the region
  • Heatmap and court mix per club
About club reports

Club report

Sample view

Next 30 days

Sample club

4 courts · indoor

Peer group: similar clubs nearby

Demand rate

39%

Group median 39%

Occupancy rate

44%

Blocked time 7%

Achieved price

€33

Range €26 to €39

Peak slot

Fri 7-9 pm

Most booked window

Utilization by hour and weekday

Sample view with demo data

Profitability calculator

Will a new site pay off?

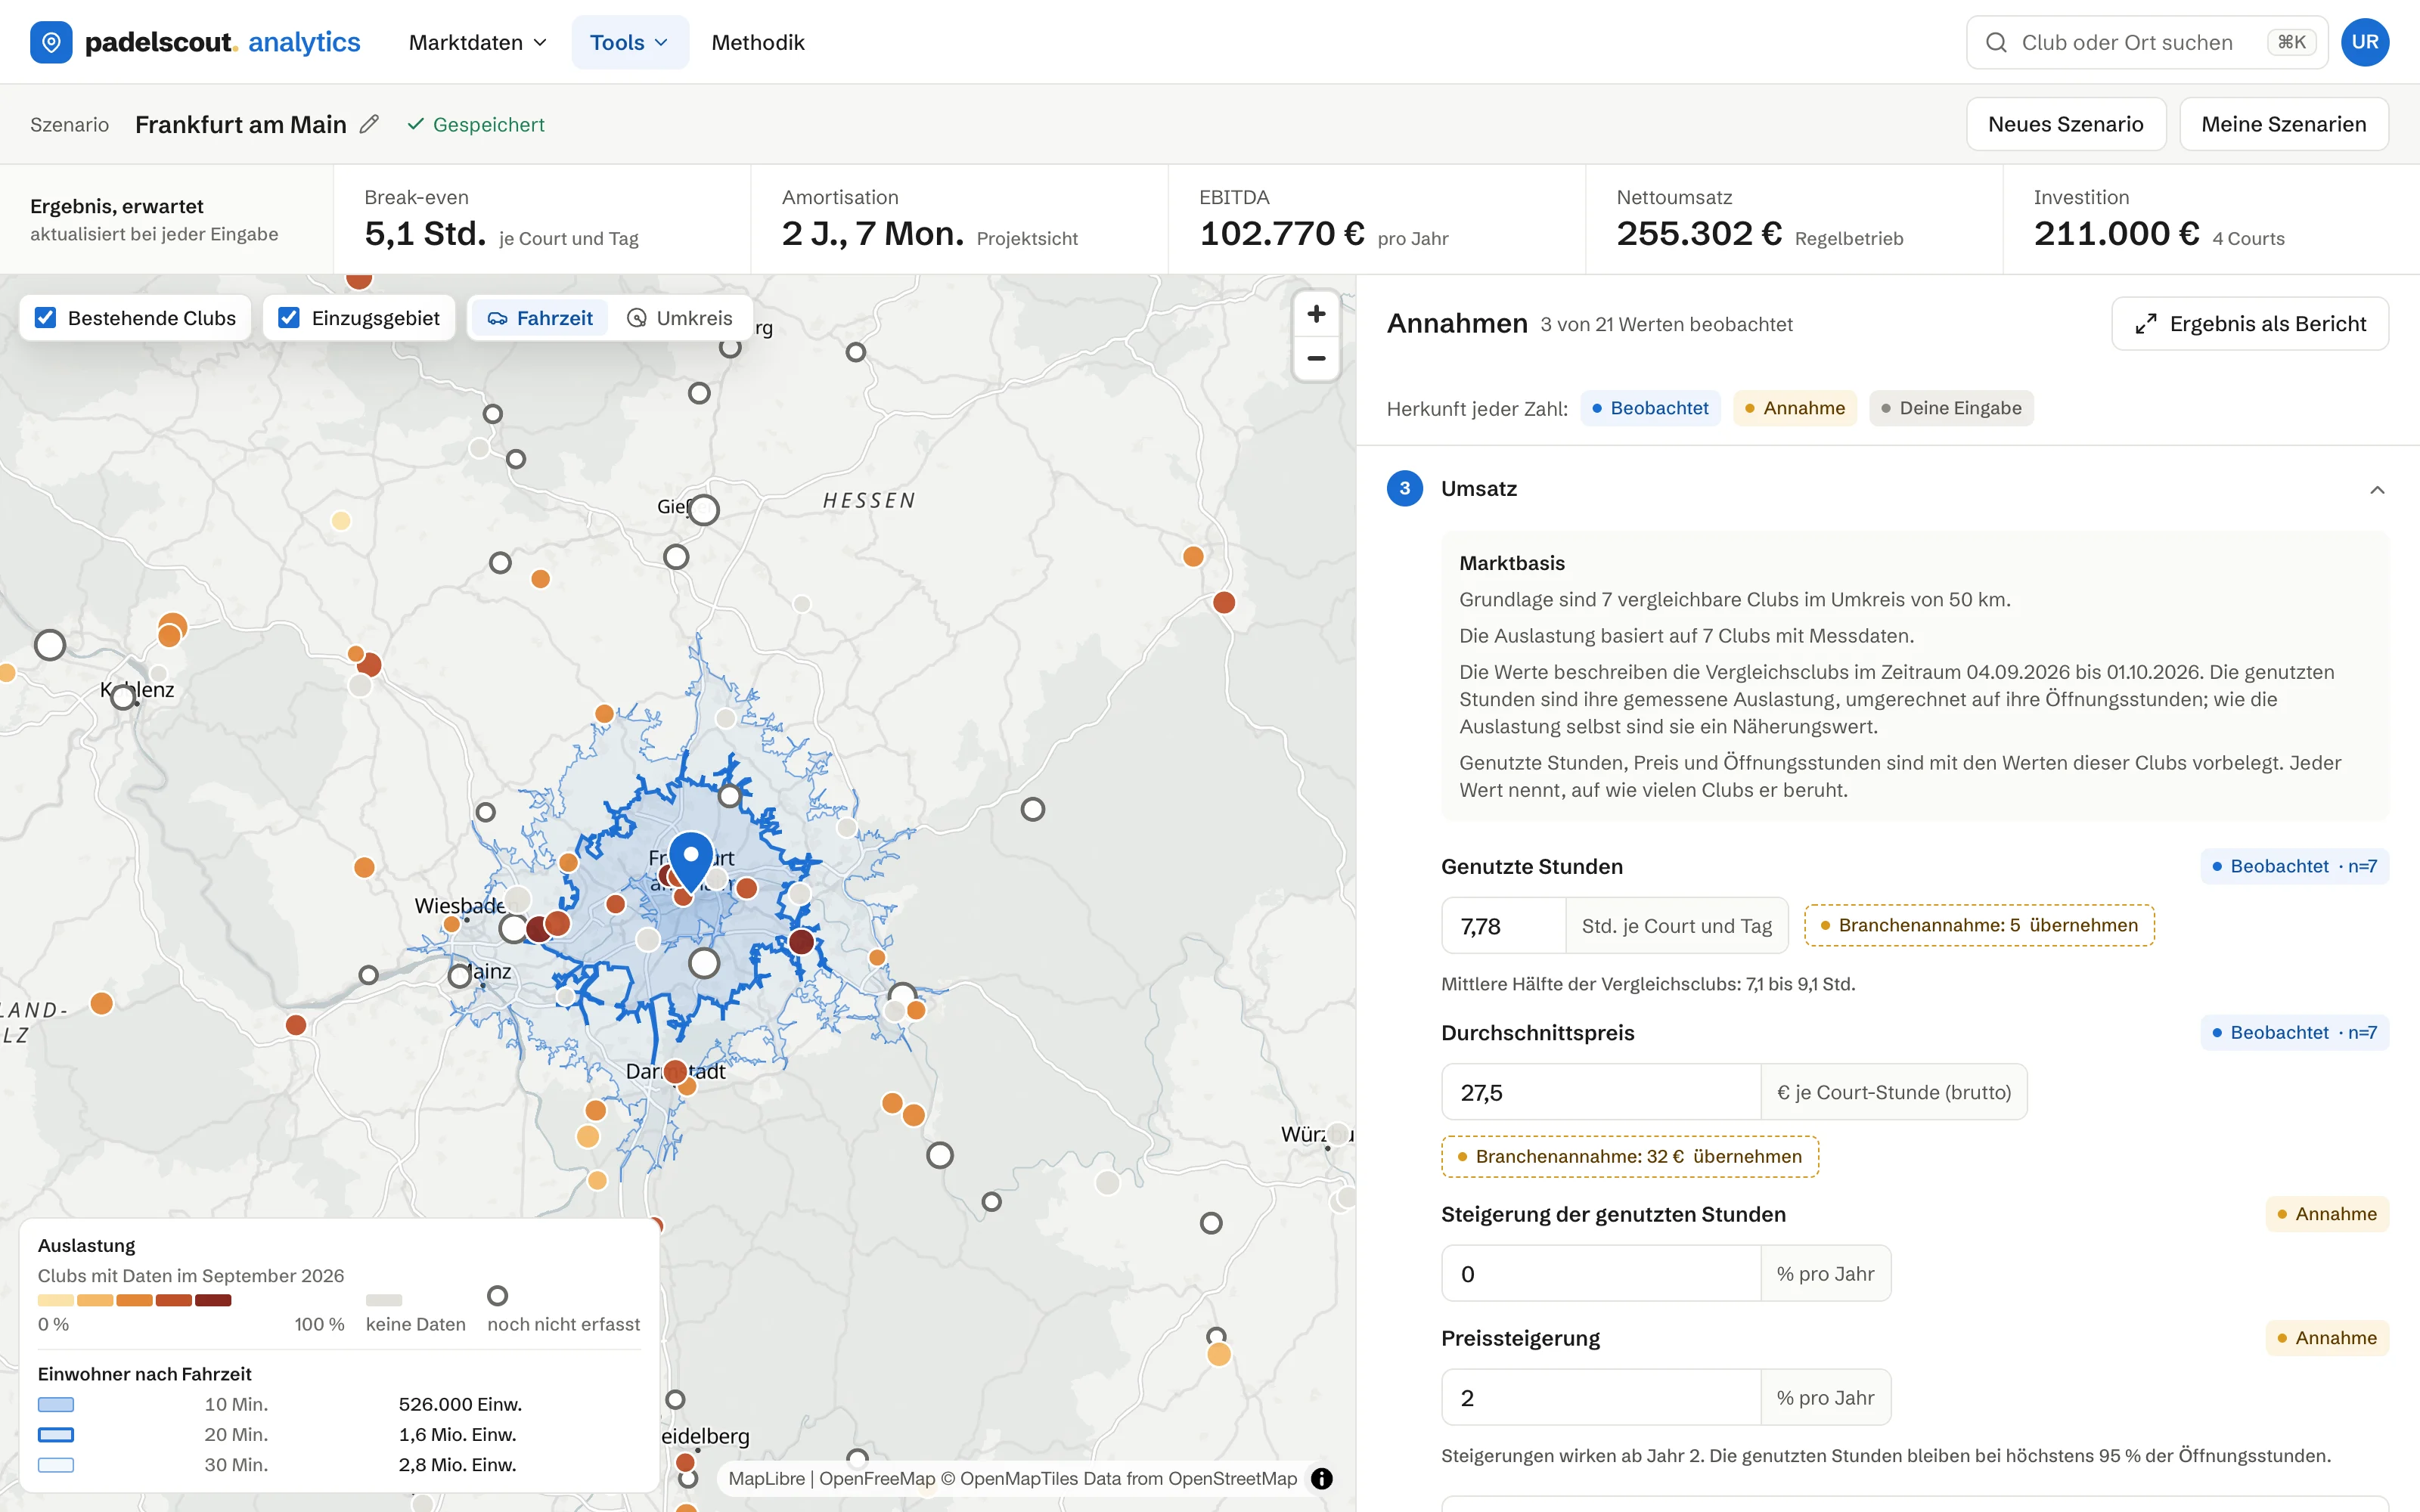
The revenue estimate comes from comparable clubs nearby and is set against build, financing and running costs. Every assumption can be changed, and every value shows where it came from.

  • Break-even occupancy, payback and return
  • Observed values, assumptions and your own inputs kept apart
  • Conservative and optimistic scenarios included
Try the free calculator

Scenario

Sample view

Investment €332,000

Hall conversion · 4 courts

Where values come from

ObservedAssumptionYour input

Break-even occupancy

27%

Expected utilization 38% (bar), the tick marks break-even.

Payback

4 yrs 1 mo

Equity payback 2 yrs 4 mo

Net ROI 10 years

175%

Conservative 52% · optimistic 268%

Sample view with demo data

  • 517

    Clubs tracked

  • 1,859

    Courts tracked

  • 393

    Locations with tracked clubs

Live figures from the tracked venues, as of today.

What Padelscout Analytics covers.

Three areas built on one dataset: the market, the individual club and the investment decision.

Market Overview and Market Map are included from Basic; Regions, Club Reports and Club Comparison from Pro; the Profitability Calculator from Investor.

Market

Countries, map and regions at a glance.

Clubs

The individual club: report and comparison.

Invest

From location to business case.

How the figures are derived.

Market figures are only as good as the method behind them. So every metric in the product states where it comes from and how much data sits behind it.

Observed booking activity

The basis is the continuously observed booking activity of the venues we track, independent of anything the clubs report themselves.

The data behind every figure

Every tile shows how many clubs and observations it rests on. Thin data is flagged as thin.

Medians and quartile ranges

Prices and projections use medians and quartile ranges, so a few outliers do not skew the picture.

Every metric documented

Every metric links to a methodology page inside the product that explains how it is calculated and where its limits are.

For operators and investors.

For club operators

See where your club stands in its market.

  • Is my utilization above or below the clubs around me?
  • Do my prices hold up against the competition?
  • When are my peak hours, and how full are they?

For investors and expansion

Vet locations with market data.

  • Which regions are underserved?
  • What do comparable clubs in the target region take in?
  • What revenue range is realistic for a new site?

Frequently asked questions

What is Padelscout Analytics?

A market intelligence service for the padel industry in Germany and Austria. It brings demand, utilization, pricing and market coverage for the venues we track into one application, from the whole market down to regions and individual clubs, plus a profitability calculator for new sites.

Where does the data come from?

From the continuously observed booking activity of the padel venues we track. For every metric, the product shows the data behind it and the methodology.

Which markets does Padelscout Analytics cover?

Germany and Austria, each as a market of its own.

How current are the numbers?

Booking activity is observed continuously. The metrics refer to the period you select in the product; inventory figures such as clubs and courts are as of today.

How are demand and occupancy calculated?

The demand rate is booked court-hours as a share of the court-hours offered for booking; time blocked by the club does not count as demand. The occupancy rate includes those blocks. Both apply to the selected period and state the data they rest on.

Are the figures observations or estimates?

Demand, occupancy and prices come from observed bookings. Anything estimated is labeled as an estimate, for example the revenue range in the profitability calculator. Thin data is flagged as thin.

Is my club included?

The product states market coverage per region, that is, what share of the known clubs is tracked. If your club is missing, email us at info@padelscout.io.

Who is Padelscout Analytics for?

For club operators, investors, property developers and associations making decisions about locations, pricing and capacity.

What is open today?

Two sample reports, a market report for Berlin and an anonymized club report, plus the profitability calculator with your own assumptions. Everything else is part of full access.

When does Padelscout Analytics launch?

Soon. If you would like to hear from us at launch, email info@padelscout.io.

What does access cost?

We will publish prices at launch.

Is Padelscout independent?

Yes. Padelscout is not owned by any club, operator or booking system, and every tracked venue is assessed with the same methodology.

Padelscout Analytics launches soon.

We are getting ready to launch. Until then, the sample reports and the profitability calculator are open to everyone.

Questions, or want to hear from us at launch? info@padelscout.io

Padelscout Analytics is the B2B service from Padelscout.