Features at a glance.
Six views of one dataset: what they show, what they rest on and the decision each one supports.
Market Overview
The market at a glance.
Included from Basic
Your starting point for a market: how much supply there is, how busy it is and how completely we track it. Country and period are yours to choose.
- Clubs, courts and locations per country
- Demand and occupancy rate for the selected period
- Market structure: club sizes, booking channels, indoor and outdoor
- Market coverage per region and new openings
Underlying data: Supply from the tracked club base, demand from observed booking activity in the selected period. Coverage compares the tracked base with every padel venue we know of in the market.
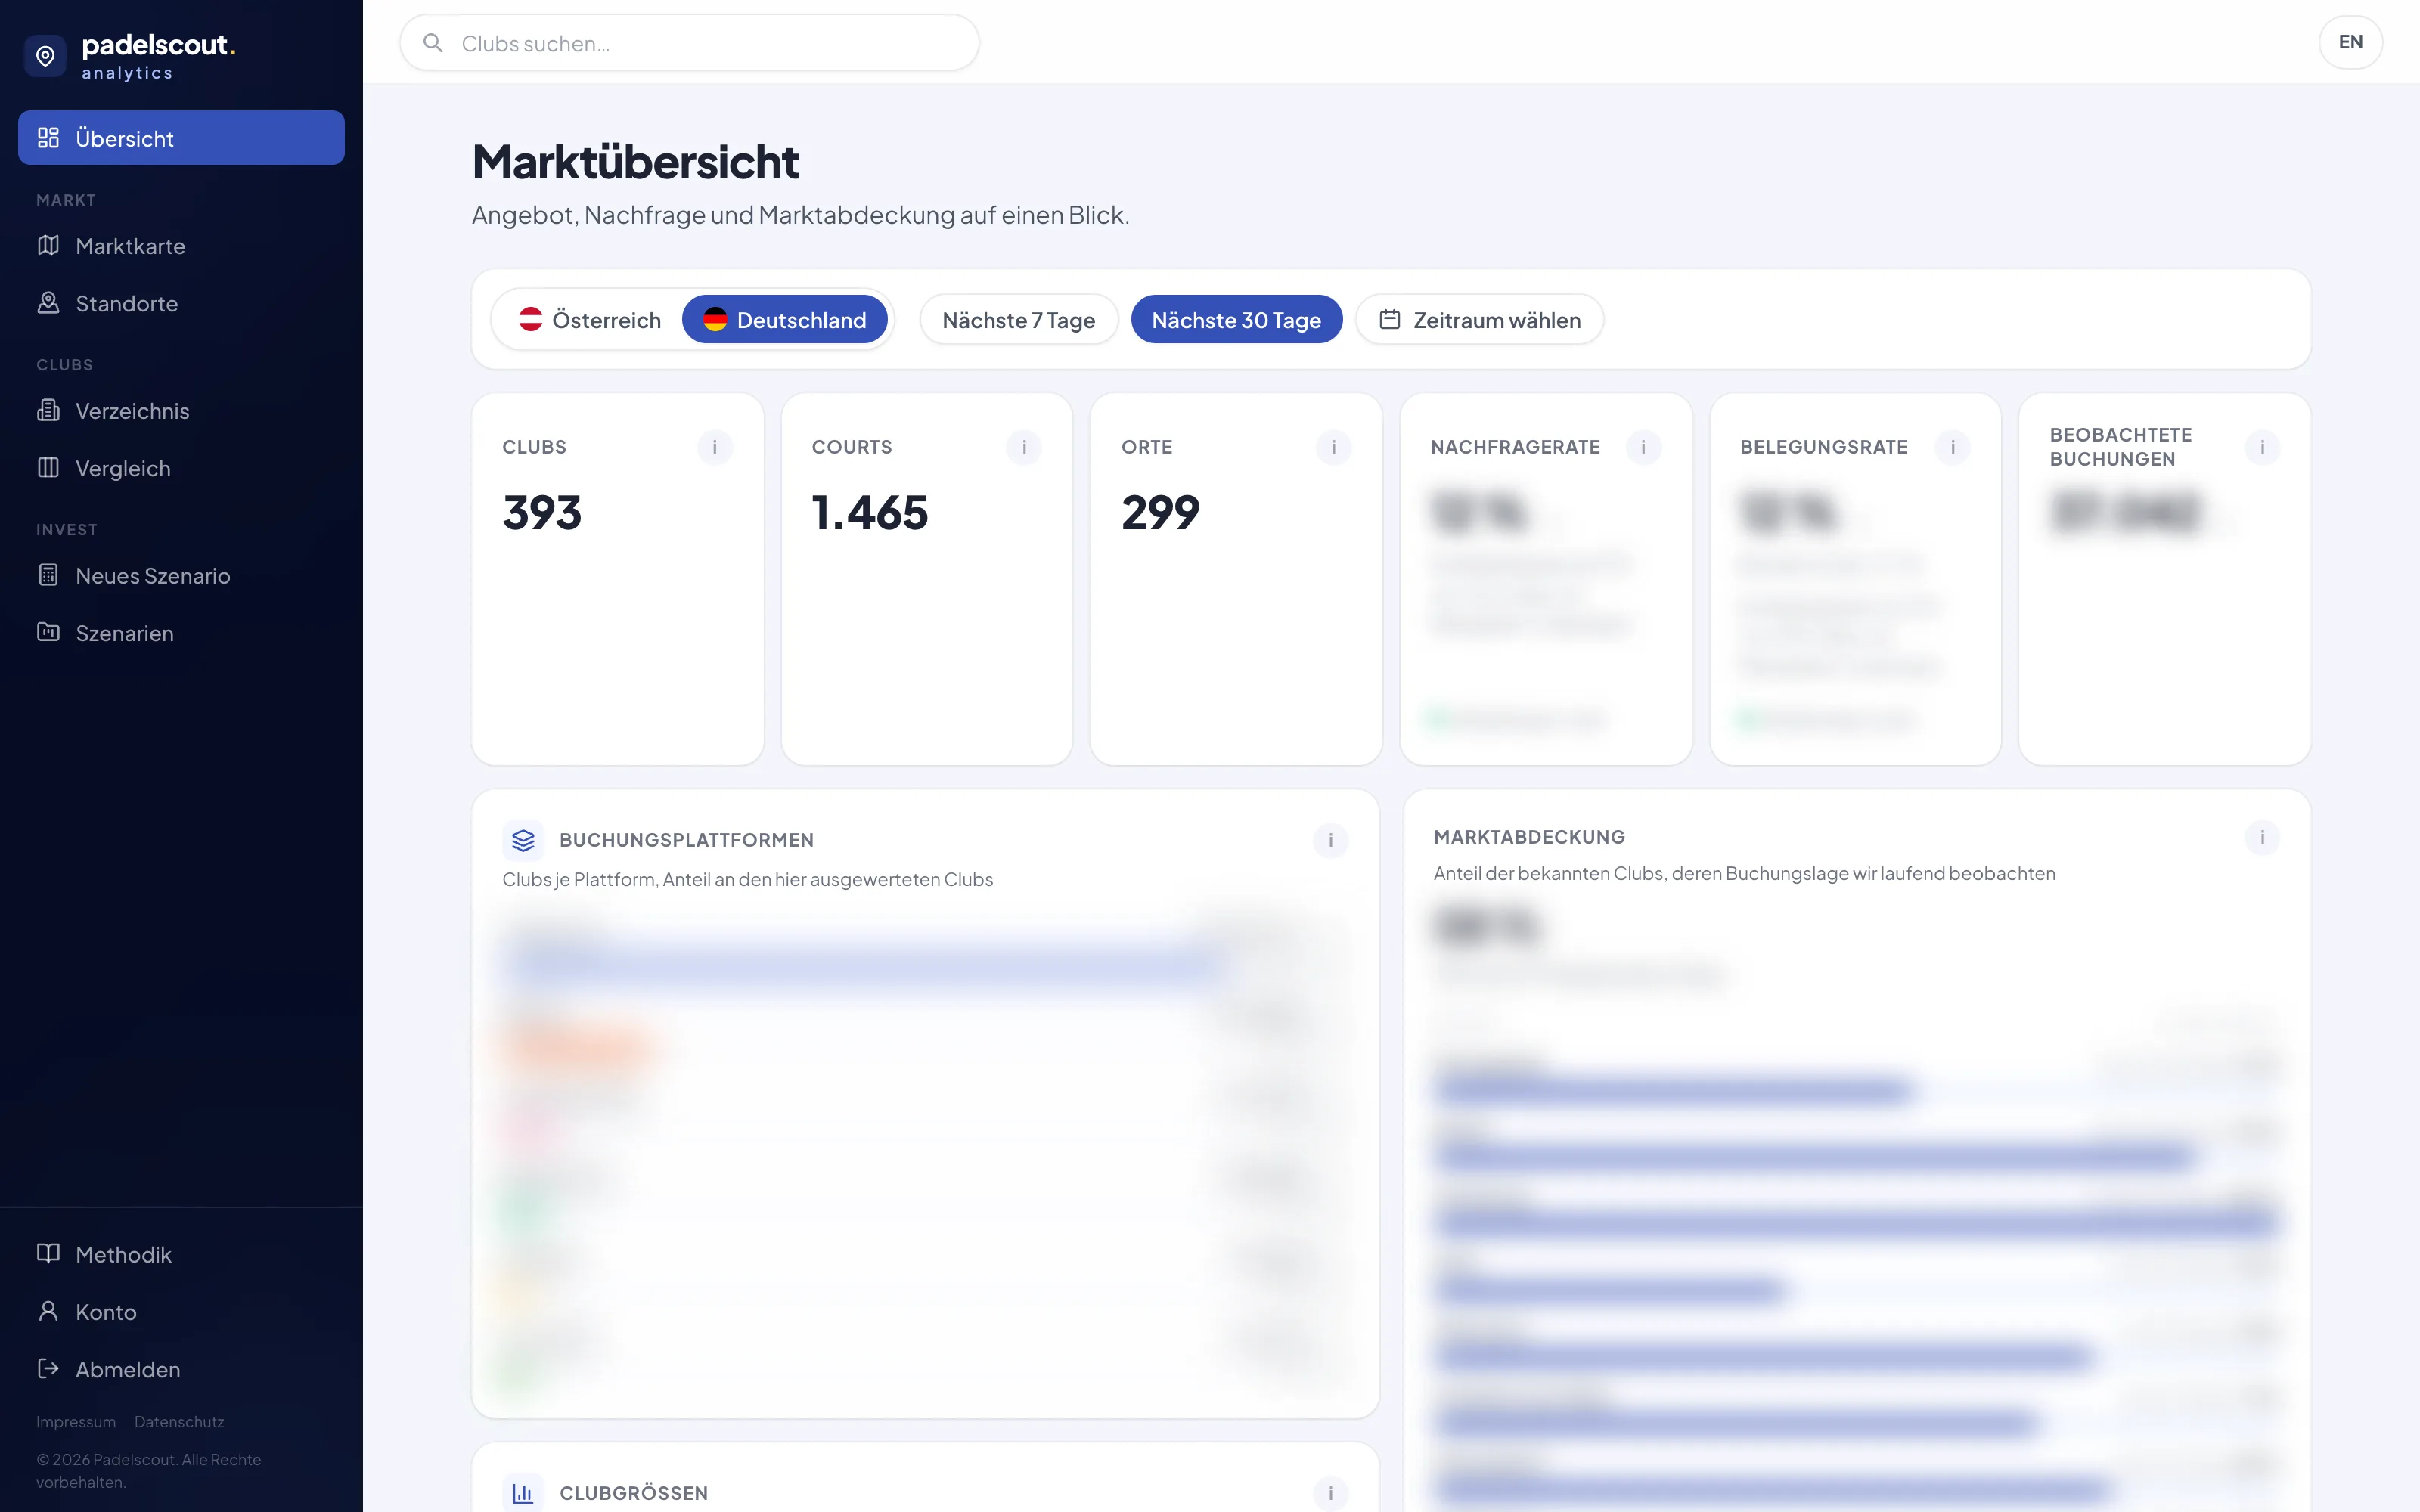
Product view. Names and some panels are obscured.
Market Map
Demand and supply, region by region.
Included from Basic
The map shows demand and supply as a hex grid across both countries. Click a hex to open its metrics and the clubs inside it.
- Demand and occupancy rate per area, color-coded on the map
- Drill down into any hex with its metrics and club list
- Filter by country, period and court type
- Underserved spots and dense regions at a glance
Underlying data: Every tile carries a coverage indicator: it shows how many observations the number rests on and says nothing about how many courts exist.
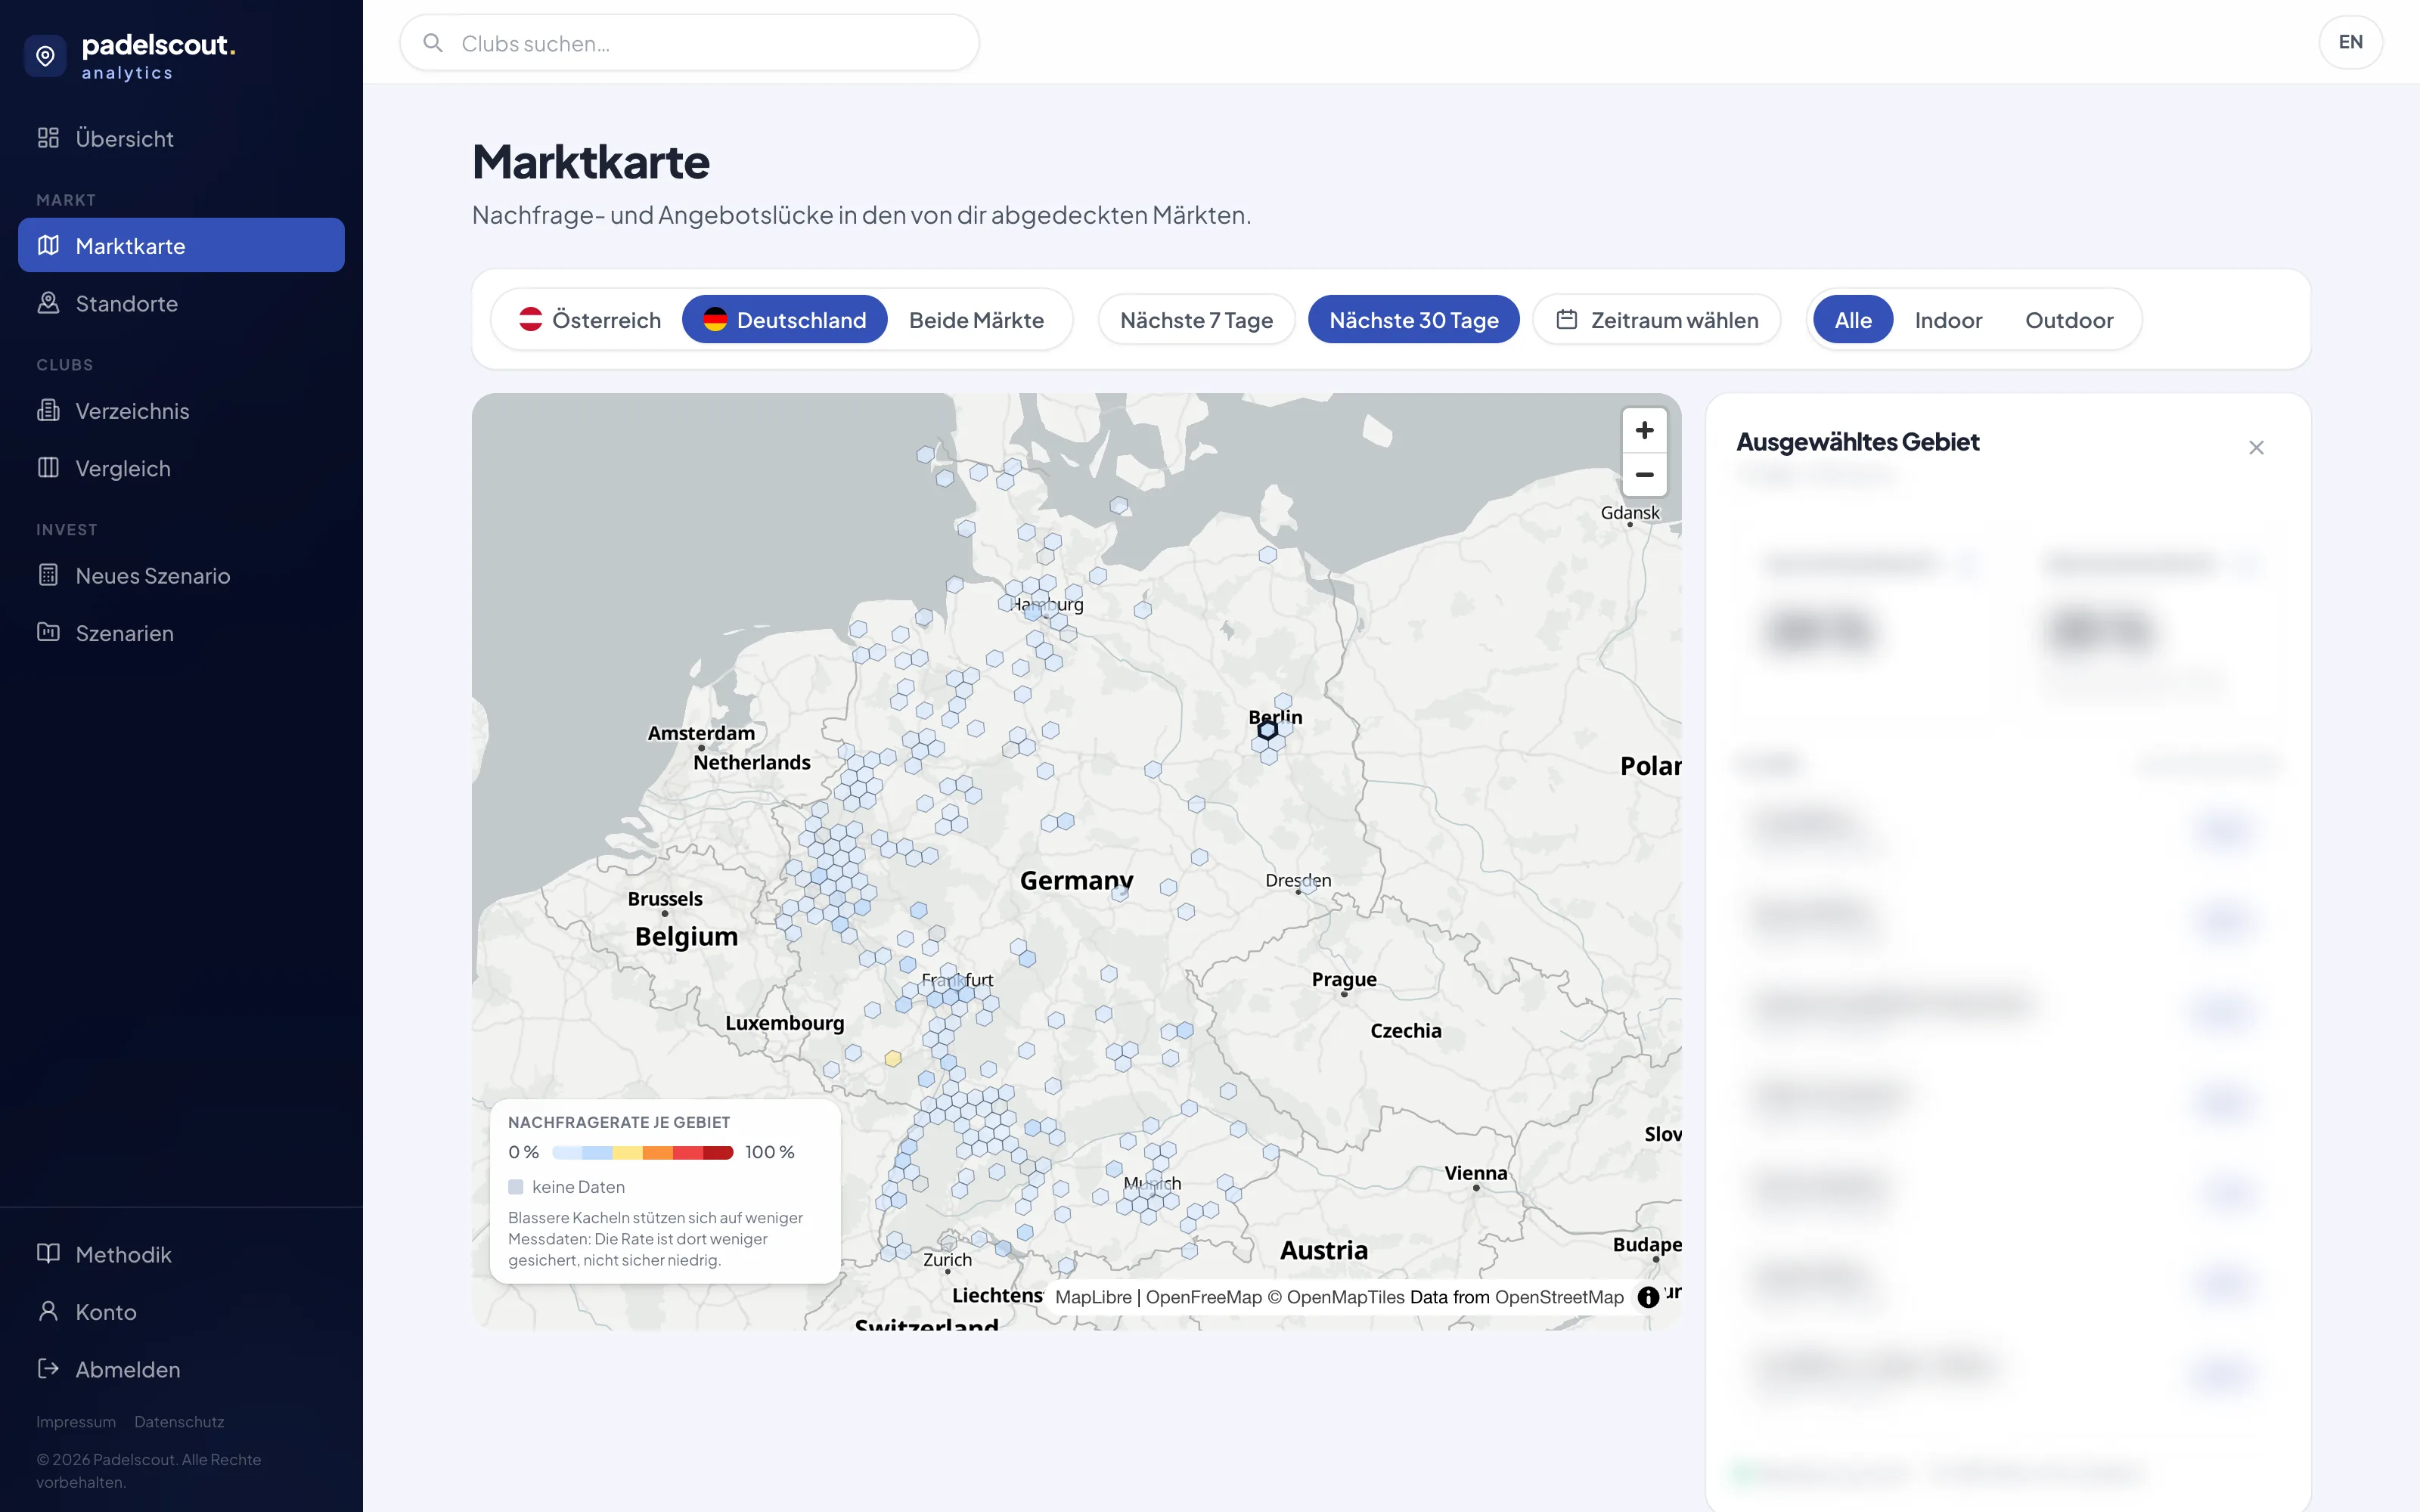
Product view. Names and some panels are obscured.
Regions
Every metro area in detail.
Included from Pro
Between country and club sits the metro area. The ranking puts every region of a market side by side, and the region report opens one of them in detail.
- Ranking of all regions by supply, demand and coverage
- Region report with key figures and peak hours
- Every tracked club in the region with its figures
- Filter by country, period and court type
Underlying data: Regions are the assigned metro areas. Coverage per region is stated against every club we know of there and does not depend on the selected period. Figures come exclusively from the tracked clubs.
The regional view, hands on: the free Berlin report shows this analysis for a real market. View the Berlin padel market
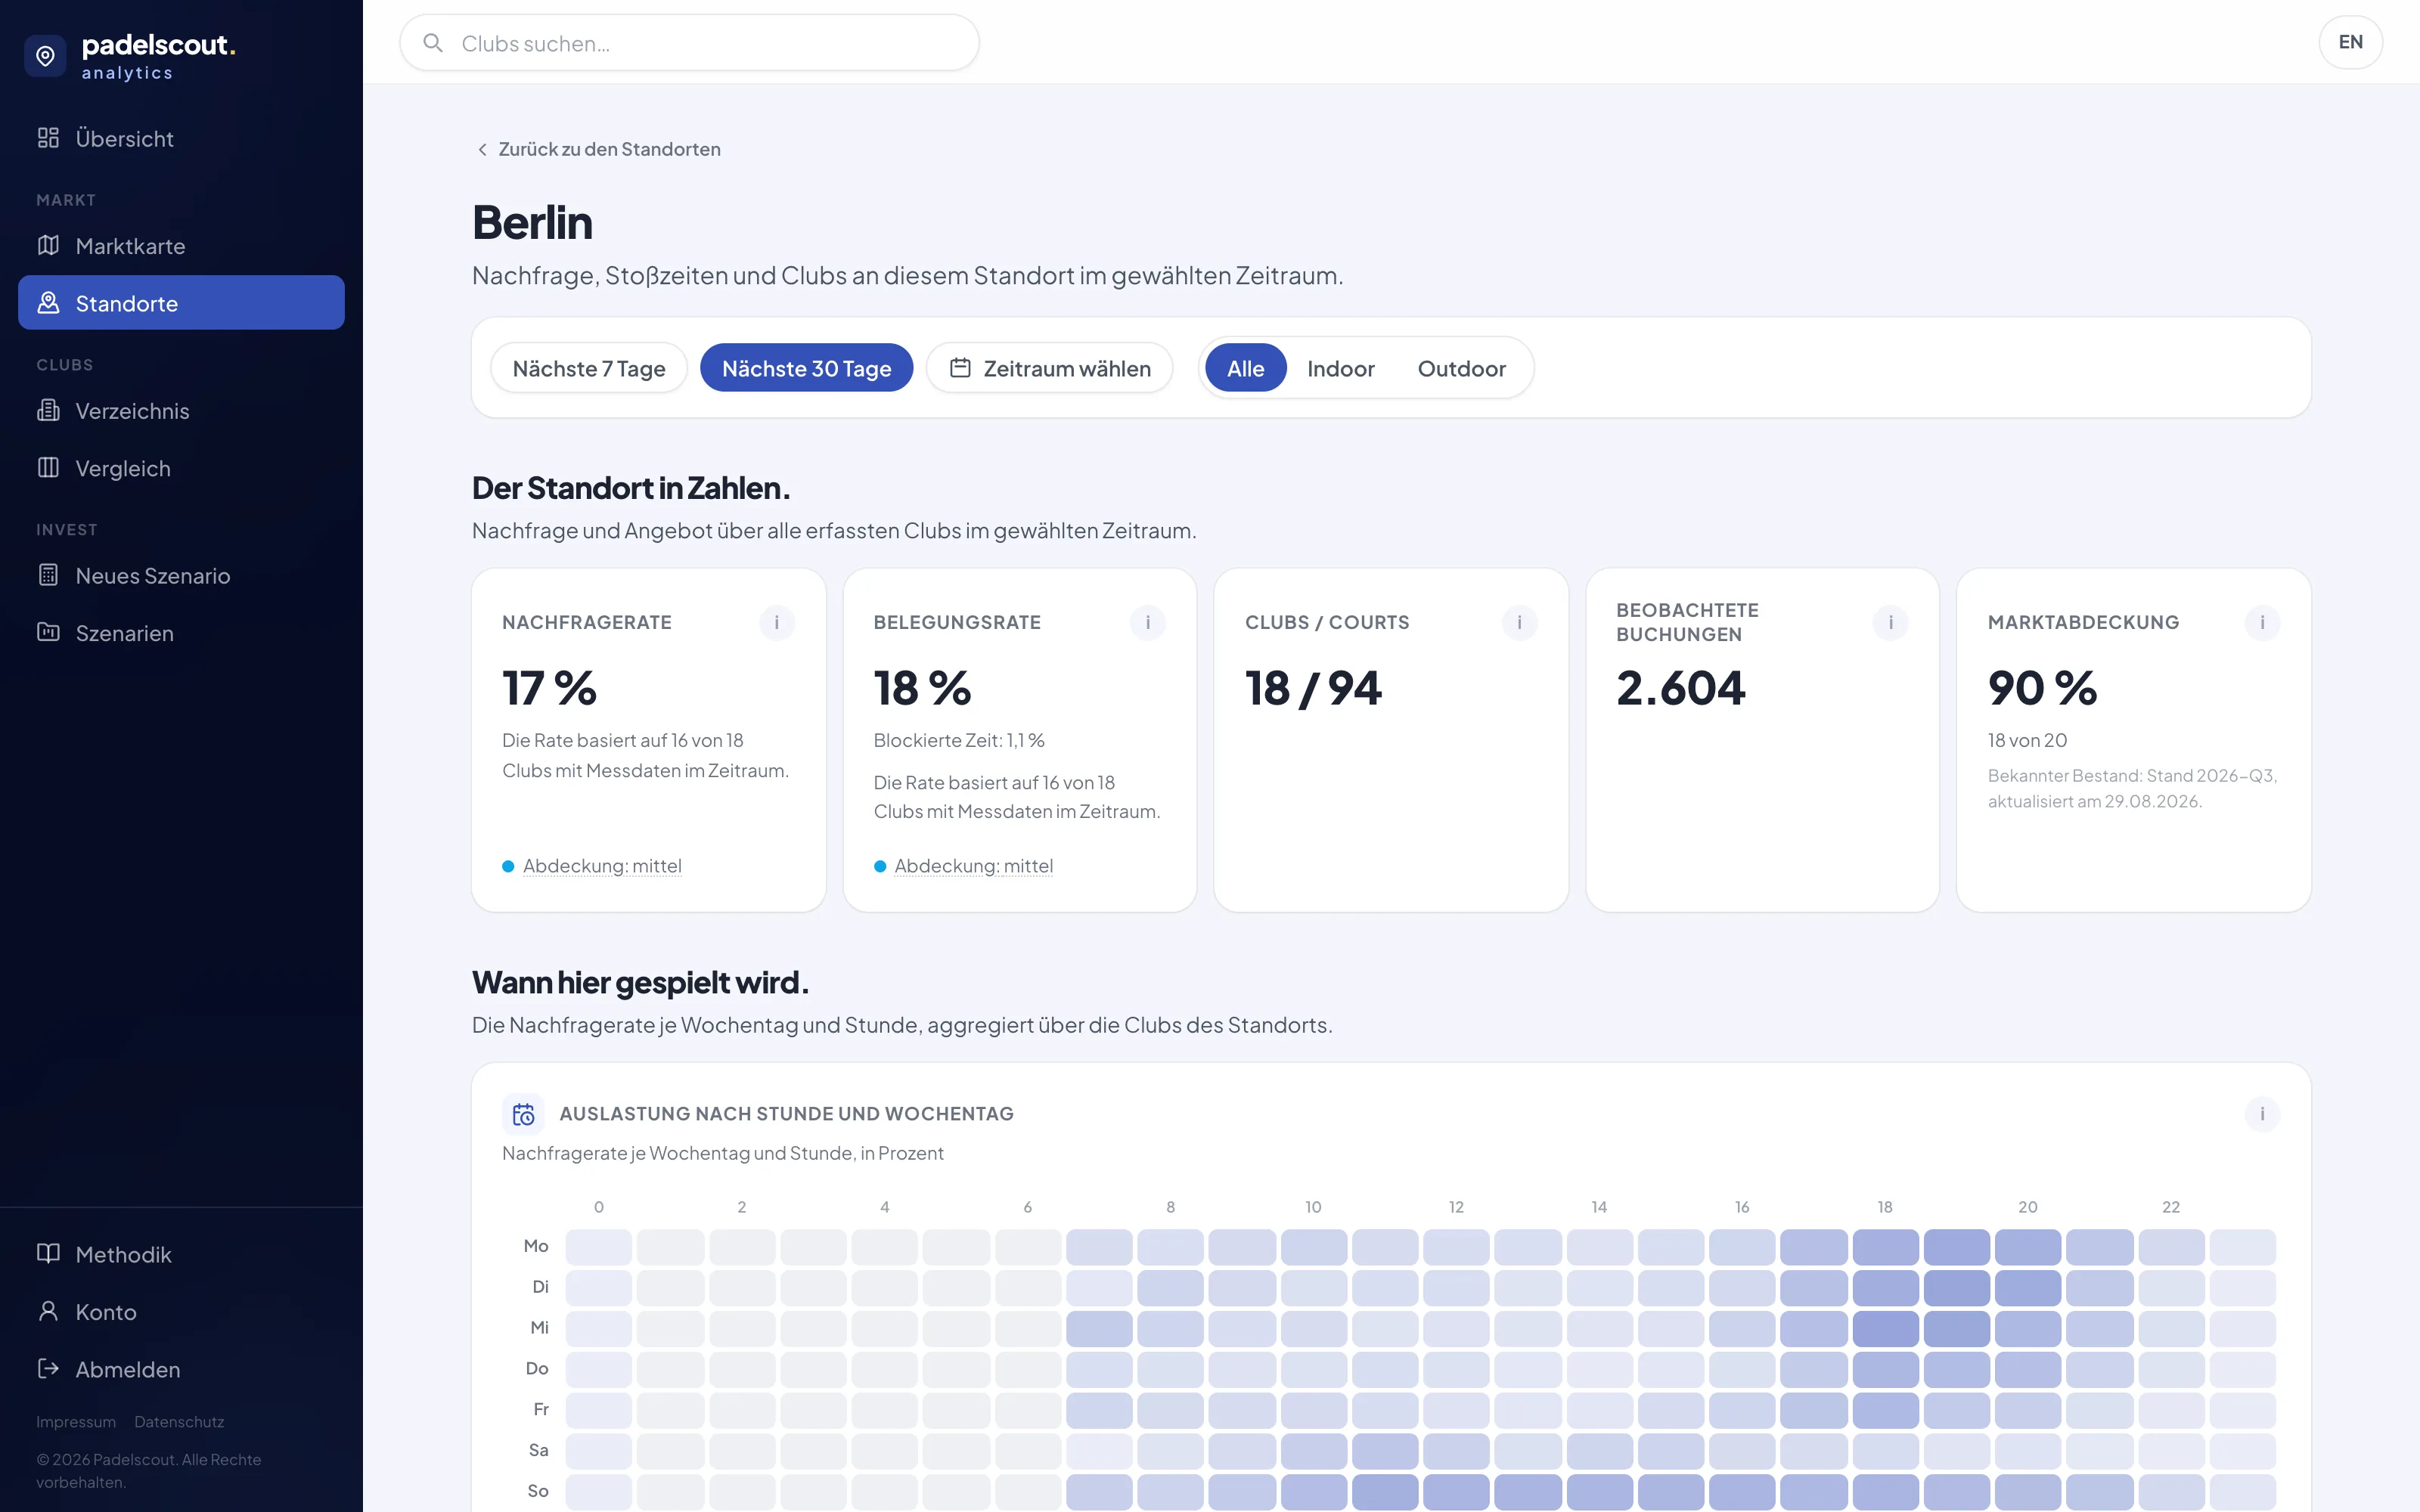
Product view. Names and some panels are obscured.
Club Reports
One club, set against its peers.
Included from Pro
One club in detail, placed from its observed booking picture. Every metric sits next to the median of its peer group nearby.
- Demand, occupancy and realized prices, each with its peer group
- Peak hours by weekday and hour
- Demand rank in the country and in the region
- Clubs nearby and market position from price and demand
Underlying data: The peer group is similar clubs nearby. Every tile carries a coverage indicator and a methodology page.
This is what a club report looks like: the free sample shows a real Berlin club, without its name. View the sample report
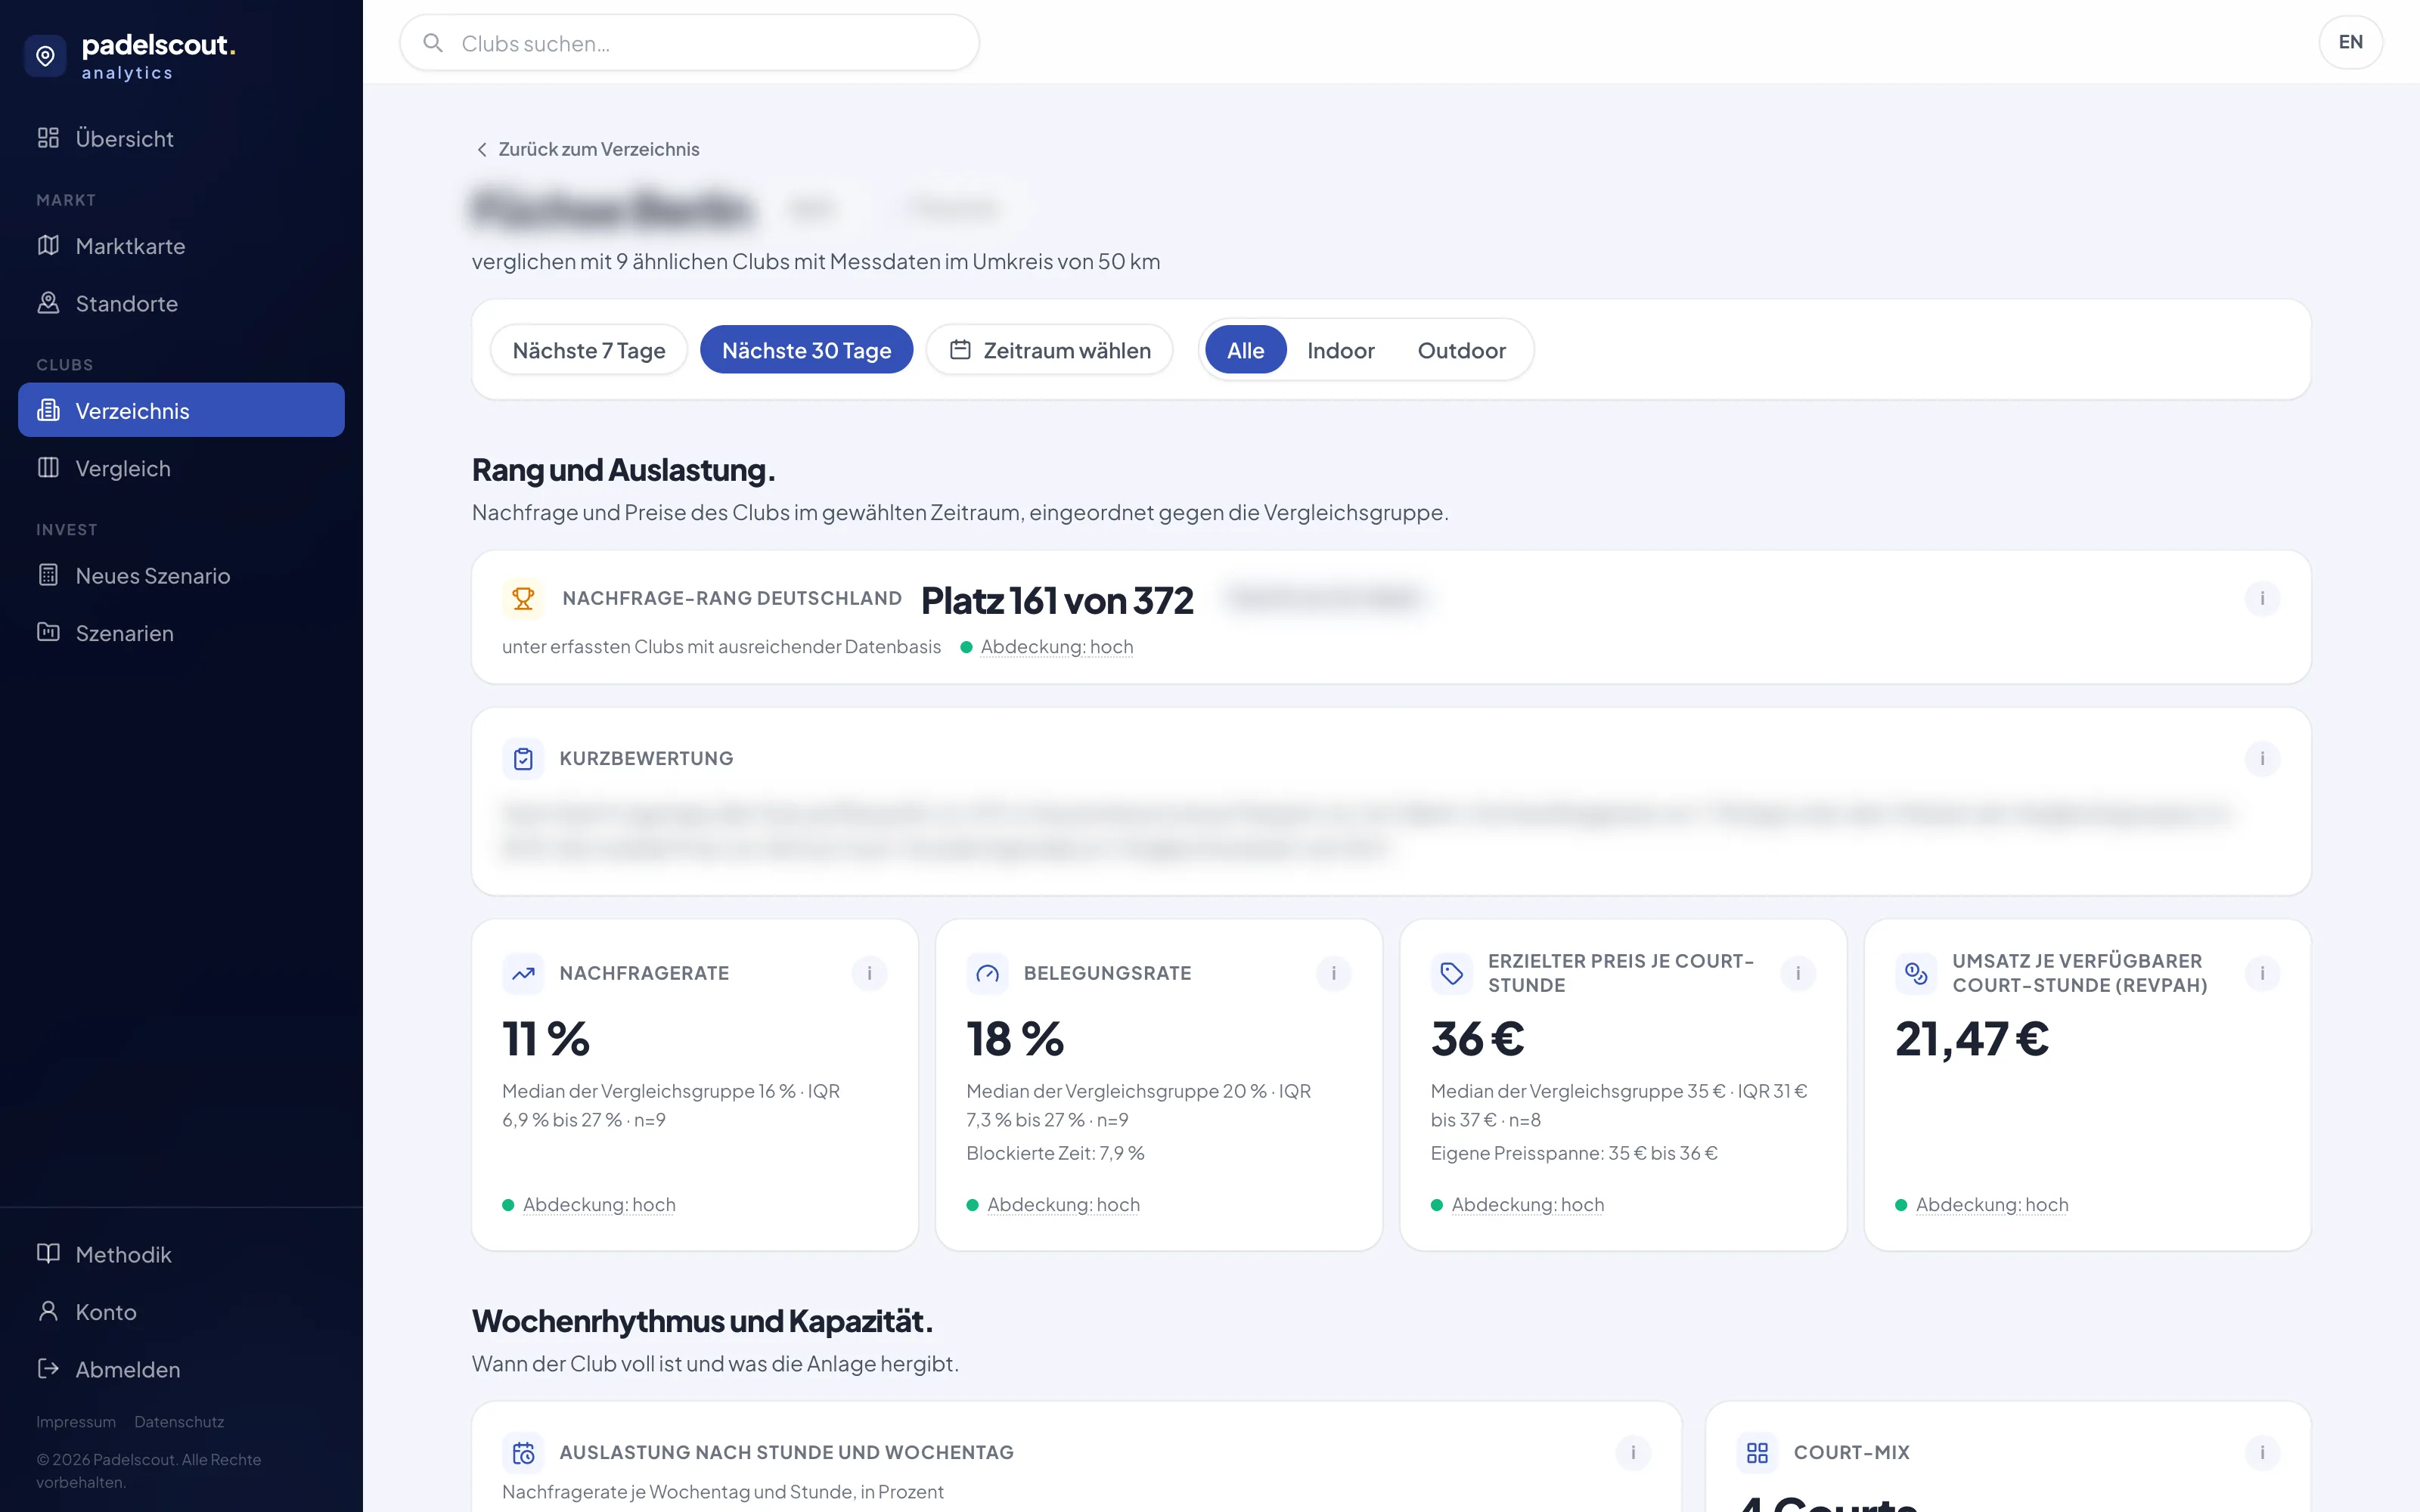
Product view. Names and some panels are obscured.
Club Comparison
Up to four clubs, side by side.
Included from Pro
Two to four clubs side by side, with the same tiles as the club report. Each club is measured against its own peer group; the other clubs in the selection play no part in that.
- Two to four clubs as columns, the same metrics in every column
- Heatmap and court mix per club
- Median and quartile range of each peer group as the anchor
- Shared filters for period and court type
Underlying data: The comparison defines no metric of its own: these are the club report's numbers, several times over.
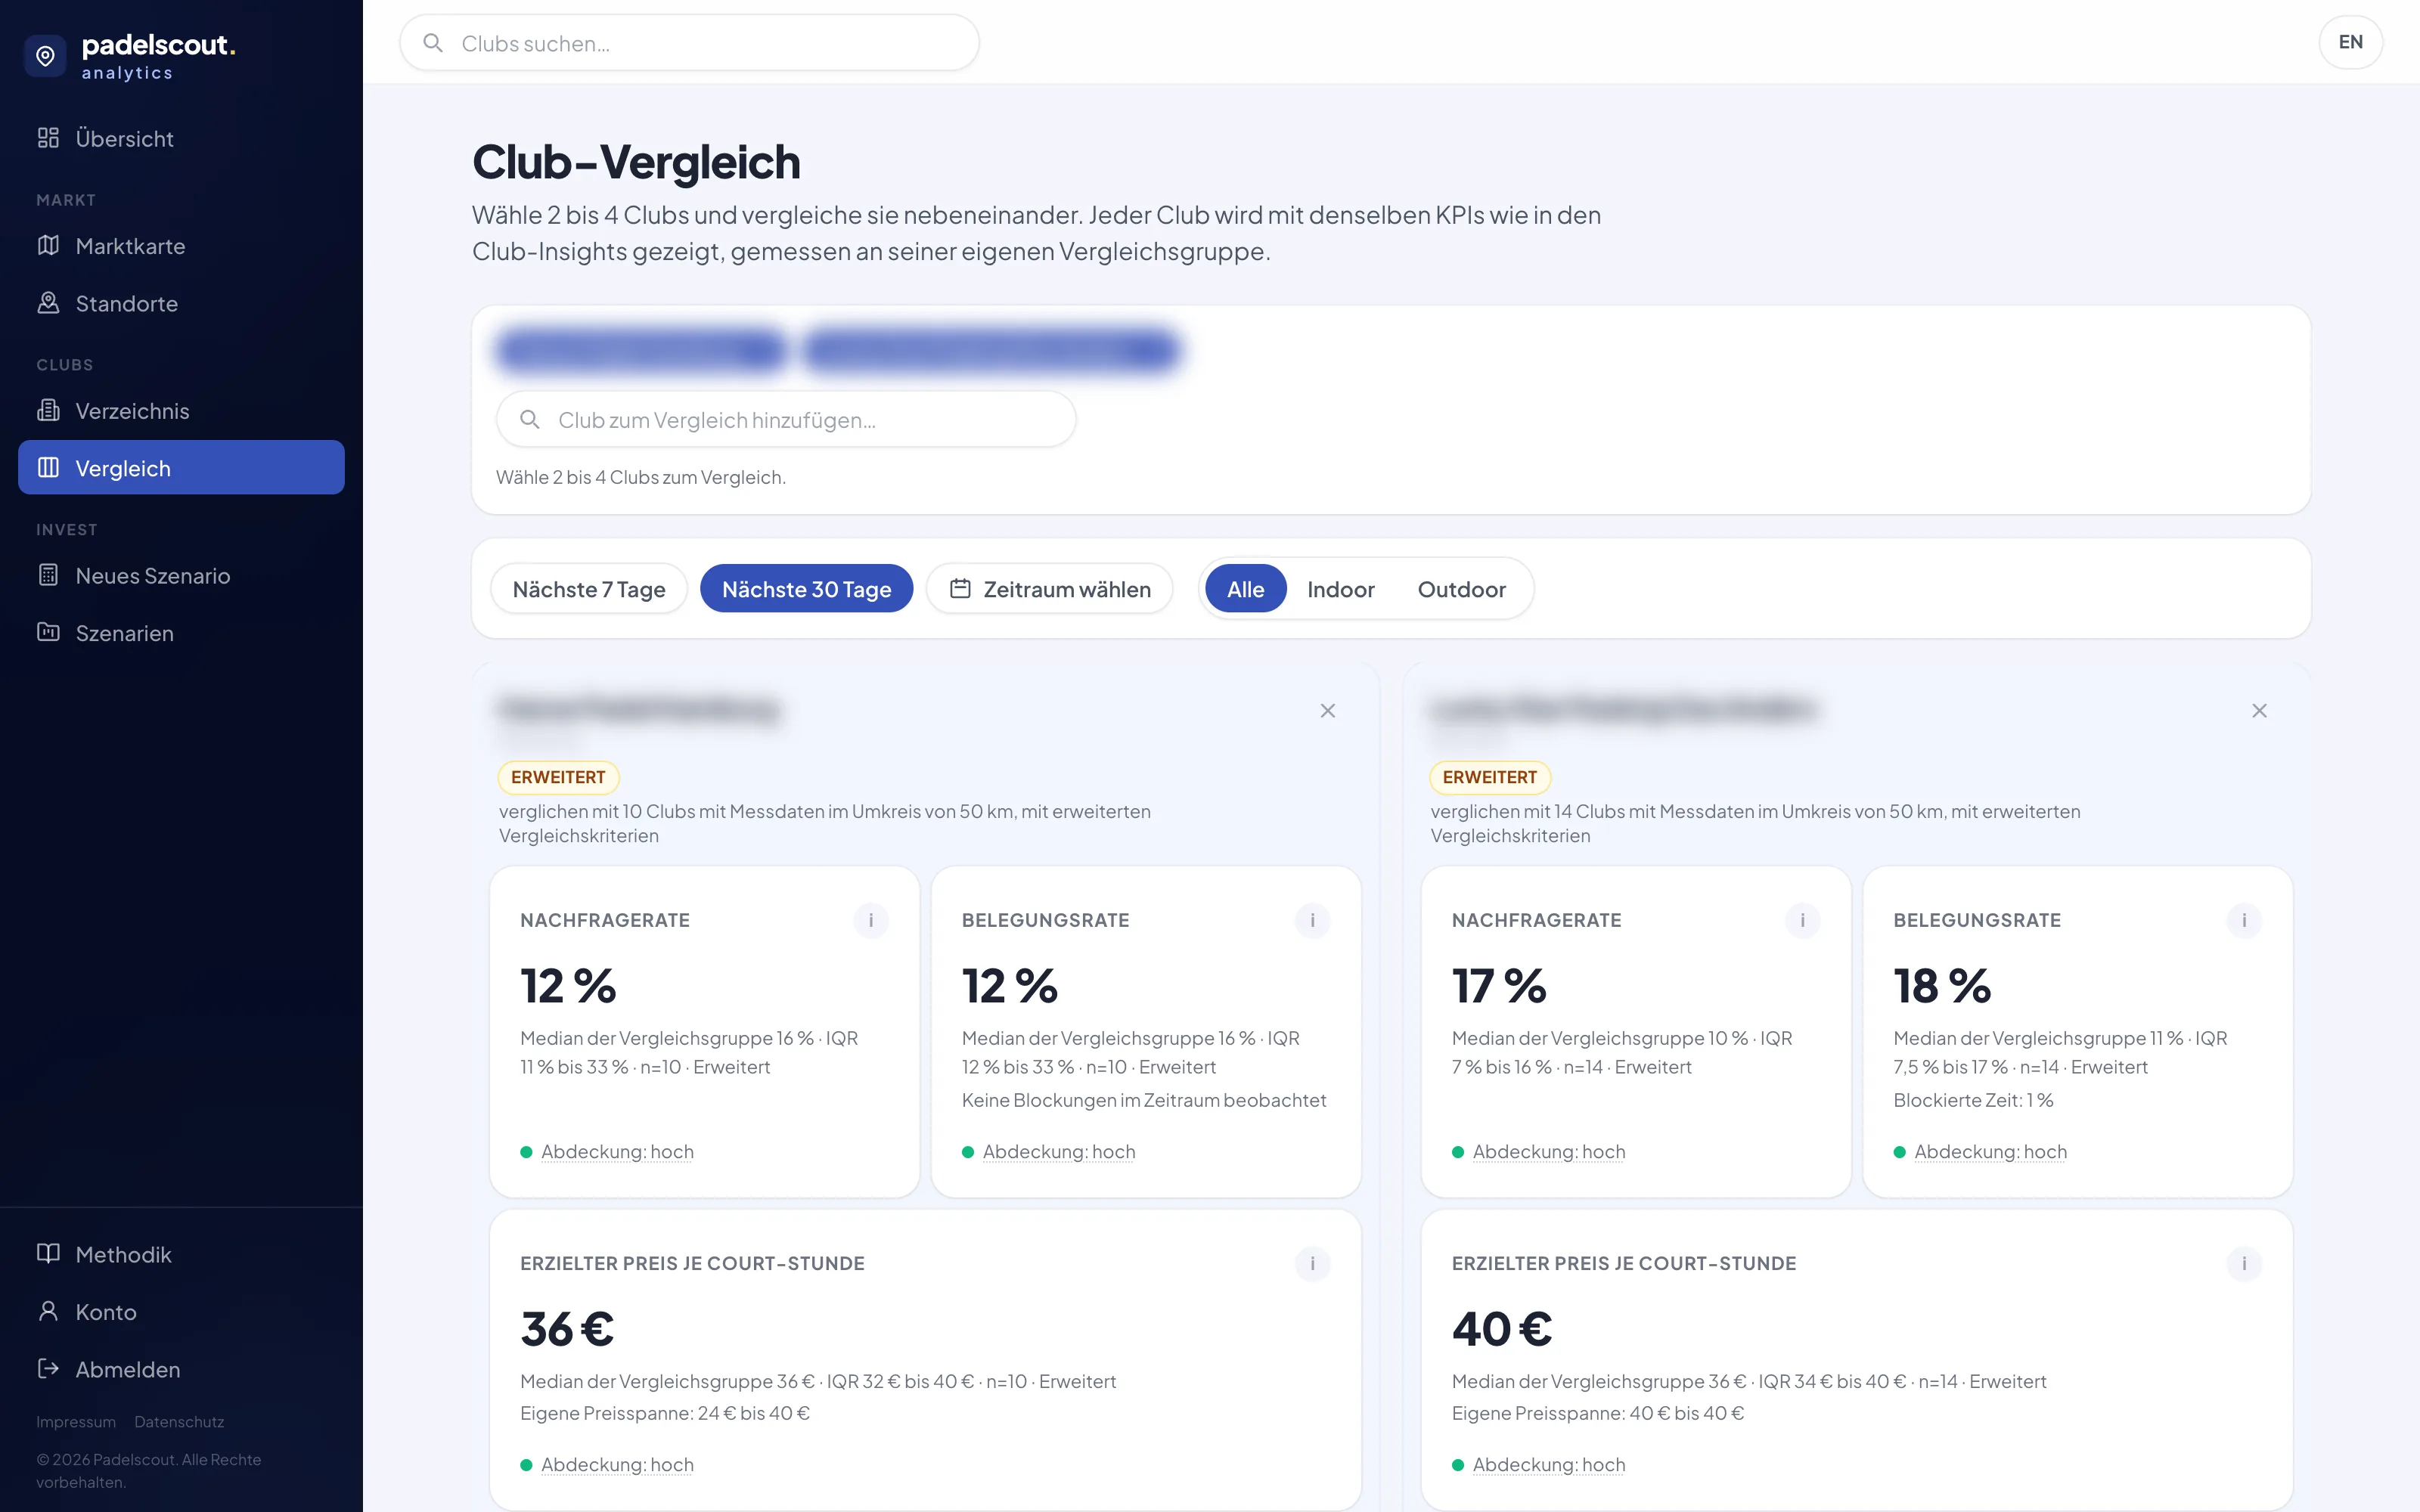
Product view. Names and some panels are obscured.
Profitability Calculator
From location to the investment decision.
Included from Investor
Drop a pin, describe the planned location and first get an annual revenue range from comparable clubs nearby. Step 2 works investment, financing and running costs against it: break-even occupancy, payback and return before tax. Scenarios can be saved and reopened.
- Pin on the map, plus courts, indoor/outdoor, single/double and the pricing assumption
- Annual revenue as a range from low through median to high
- Investment by build type, financing as an annuity, running costs
- Break-even occupancy, payback and cash-flow projection, pre-tax
Underlying data: The revenue side comes from observed data of the most similar comparable clubs, every cost assumption stays yours and is labeled as such. When the peer group is thin, that is reported instead of smoothed over.
You can try the calculator now, with your own assumptions. Open the free profitability calculator
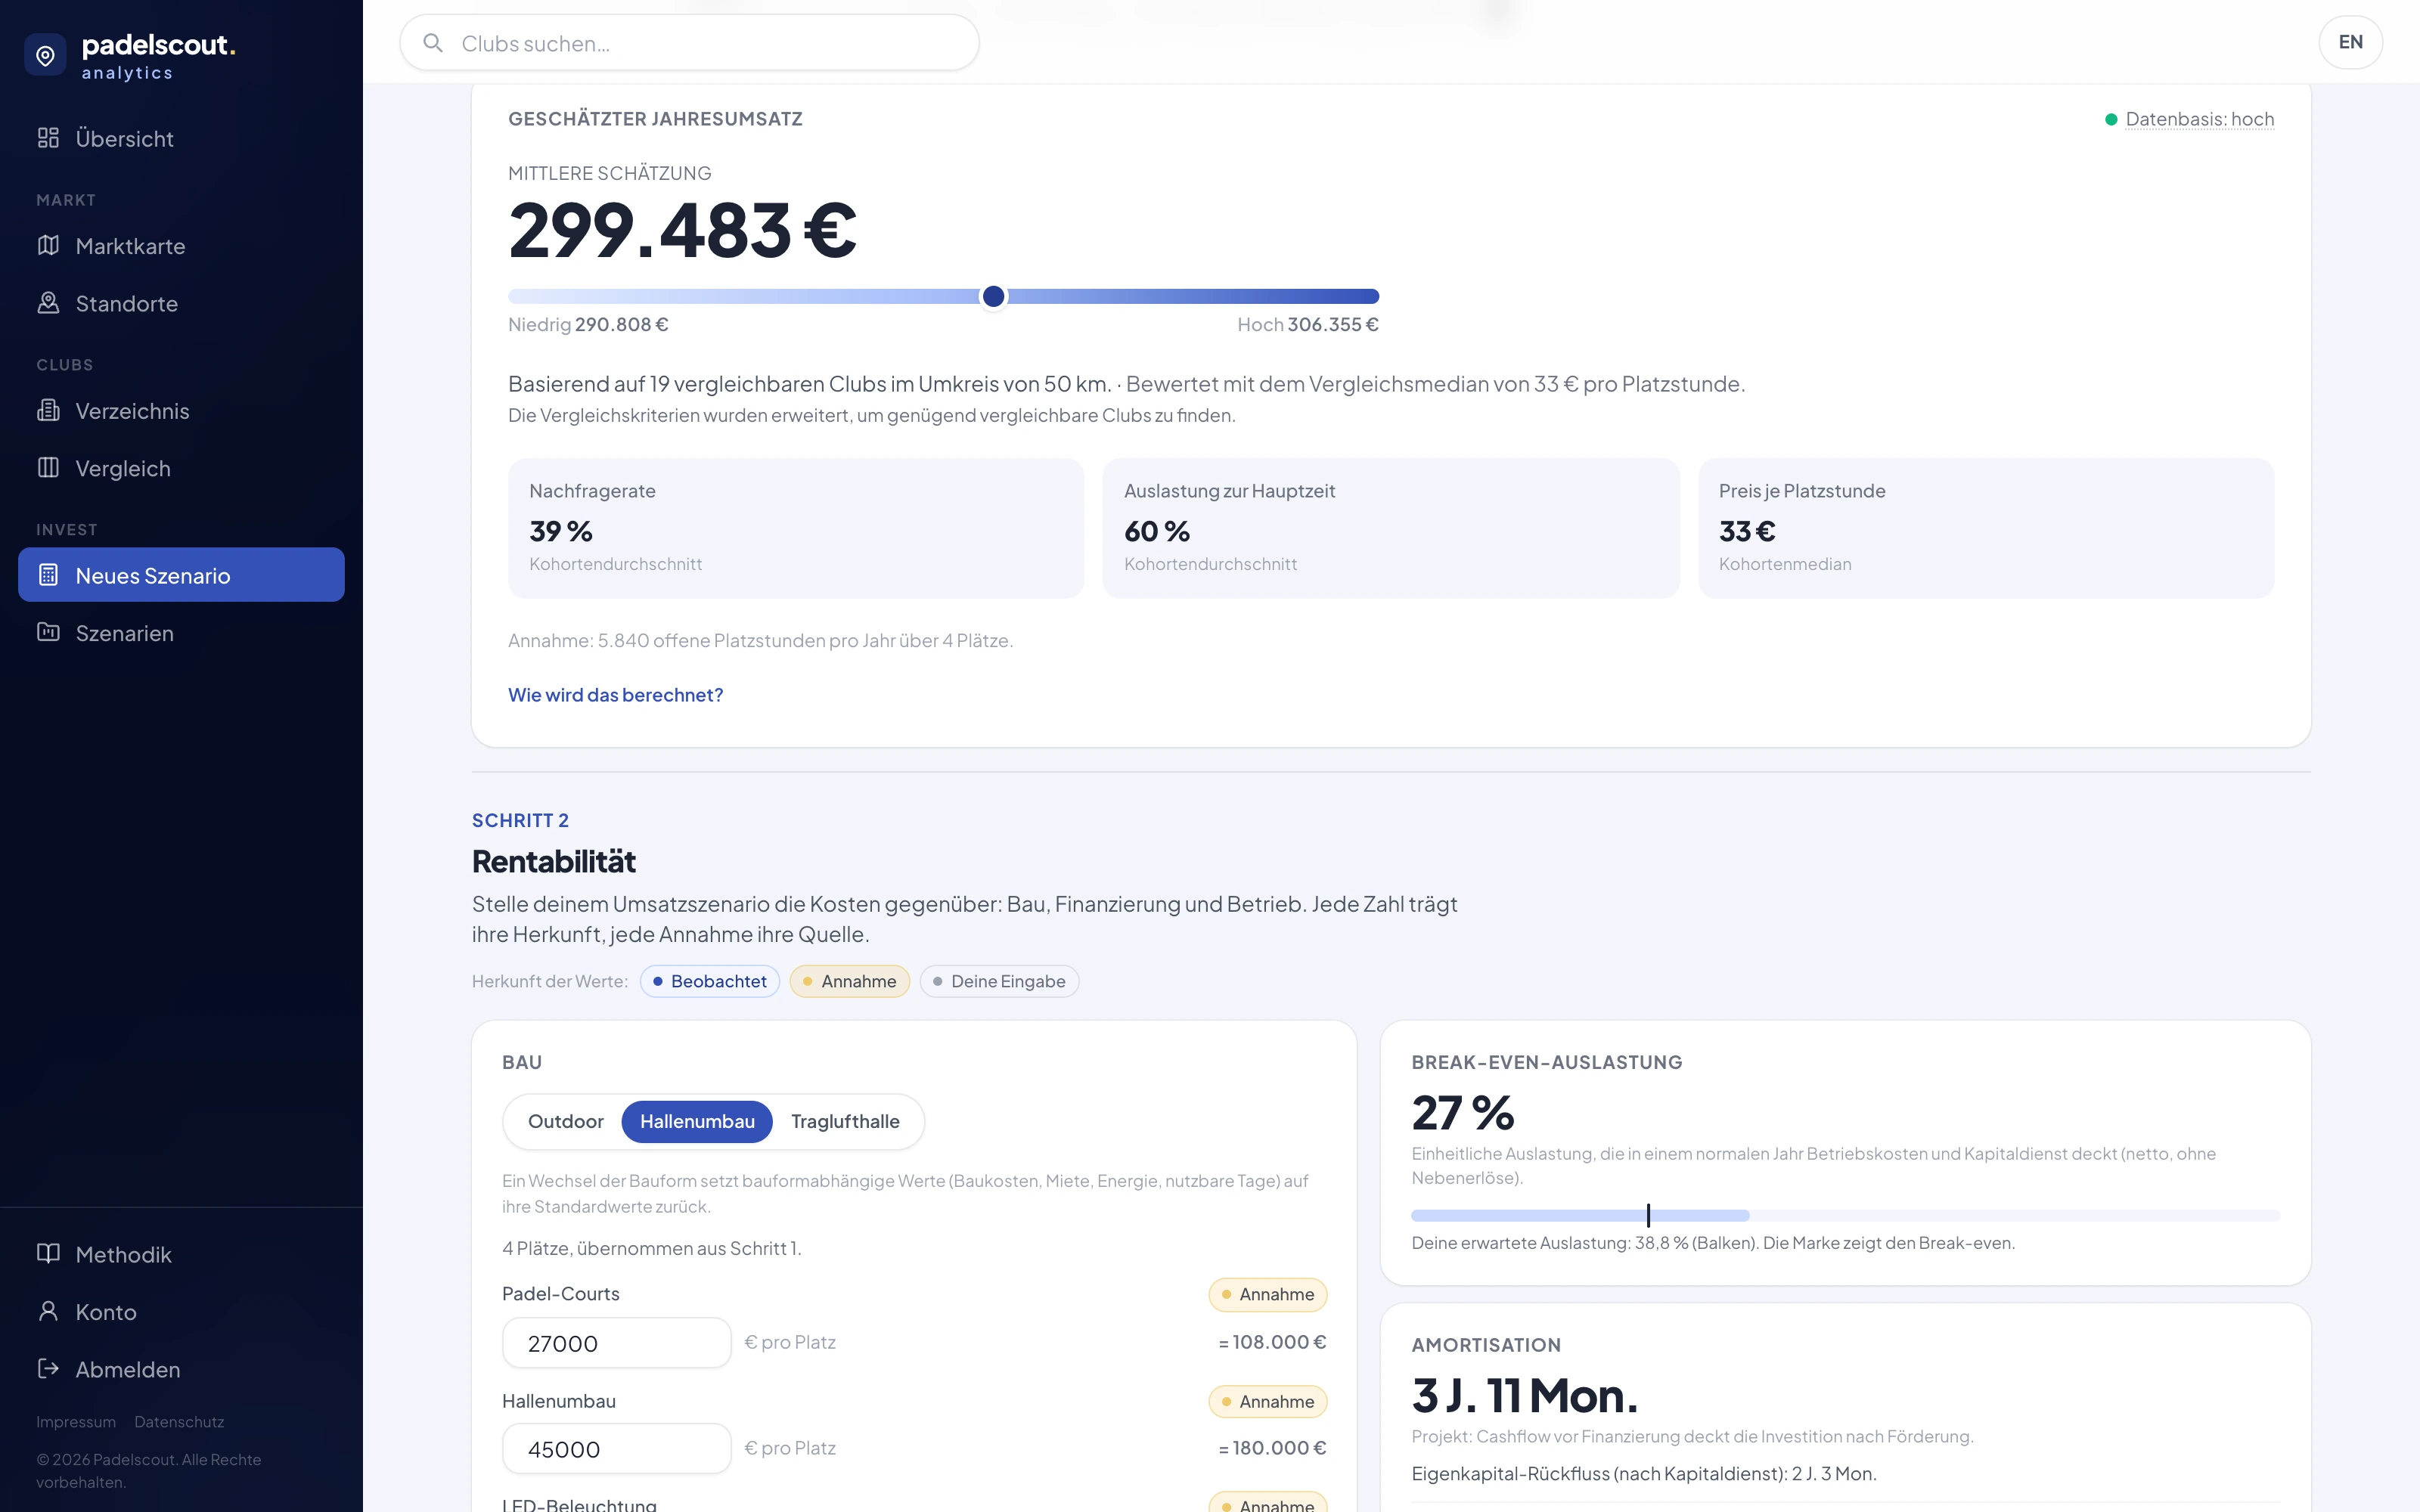
Sample view with demo data
Padelscout Analytics launches soon.
We are getting ready to launch. Until then, the sample reports and the profitability calculator are open to everyone.
Questions, or want to hear from us at launch? info@padelscout.io
Padelscout Analytics is the B2B service from Padelscout.